Creating a Super-Sitemap - A Journey Using DataViz

While visiting a web-site, there is an important link that usually sits in the footer called a Sitemap.
A sitemap is a web-page that displays the navigation of a site in a text-list form. It will start with the homepage then list the main menu and sub-menu items. It also lists the links present inside the sub-menu pages.
At the very granular level, it will list all pages on the site, presented as linear navigable links.
- Sitemaps help users to find specific pages faster, rather than go through the regular user-journey.
- Sitemaps also display the Information Architecture of the site ie categories, taxonomies and topics.
- A good example of a Sitemap would be view-source:http://www.bbc.com/hindi/sitemap.xml
Technically, the sitemaps protocol allows a webmaster to inform search engines about URLs on a website that are available for crawling. A sitemap.xml file is an XML file that lists the URLs for a site and can be found at http://sitename/sitemap.xml. It can be generated by the freely available on-line sitemap generators. It allows web-masters to include additional information about each URL eg when it was last updated, how often it changes, and how important it is in relation to other URLs in the site. This allows search engines to crawl the site more efficiently, bringing up the SEO rank of the site.
While sitemaps for single smaller sites are mostly a textual-linear list of links, what if there is a single domain with 10+ sub-sites all cross-referencing each other? This is especially true for larger sites with more than 50 pages, complex Information Architecture and externally pointing links.
The user journey could be quite complex with no clear visibility to reach key pages. The best solution would be to create a graphical representation of a domain's sitemaps.
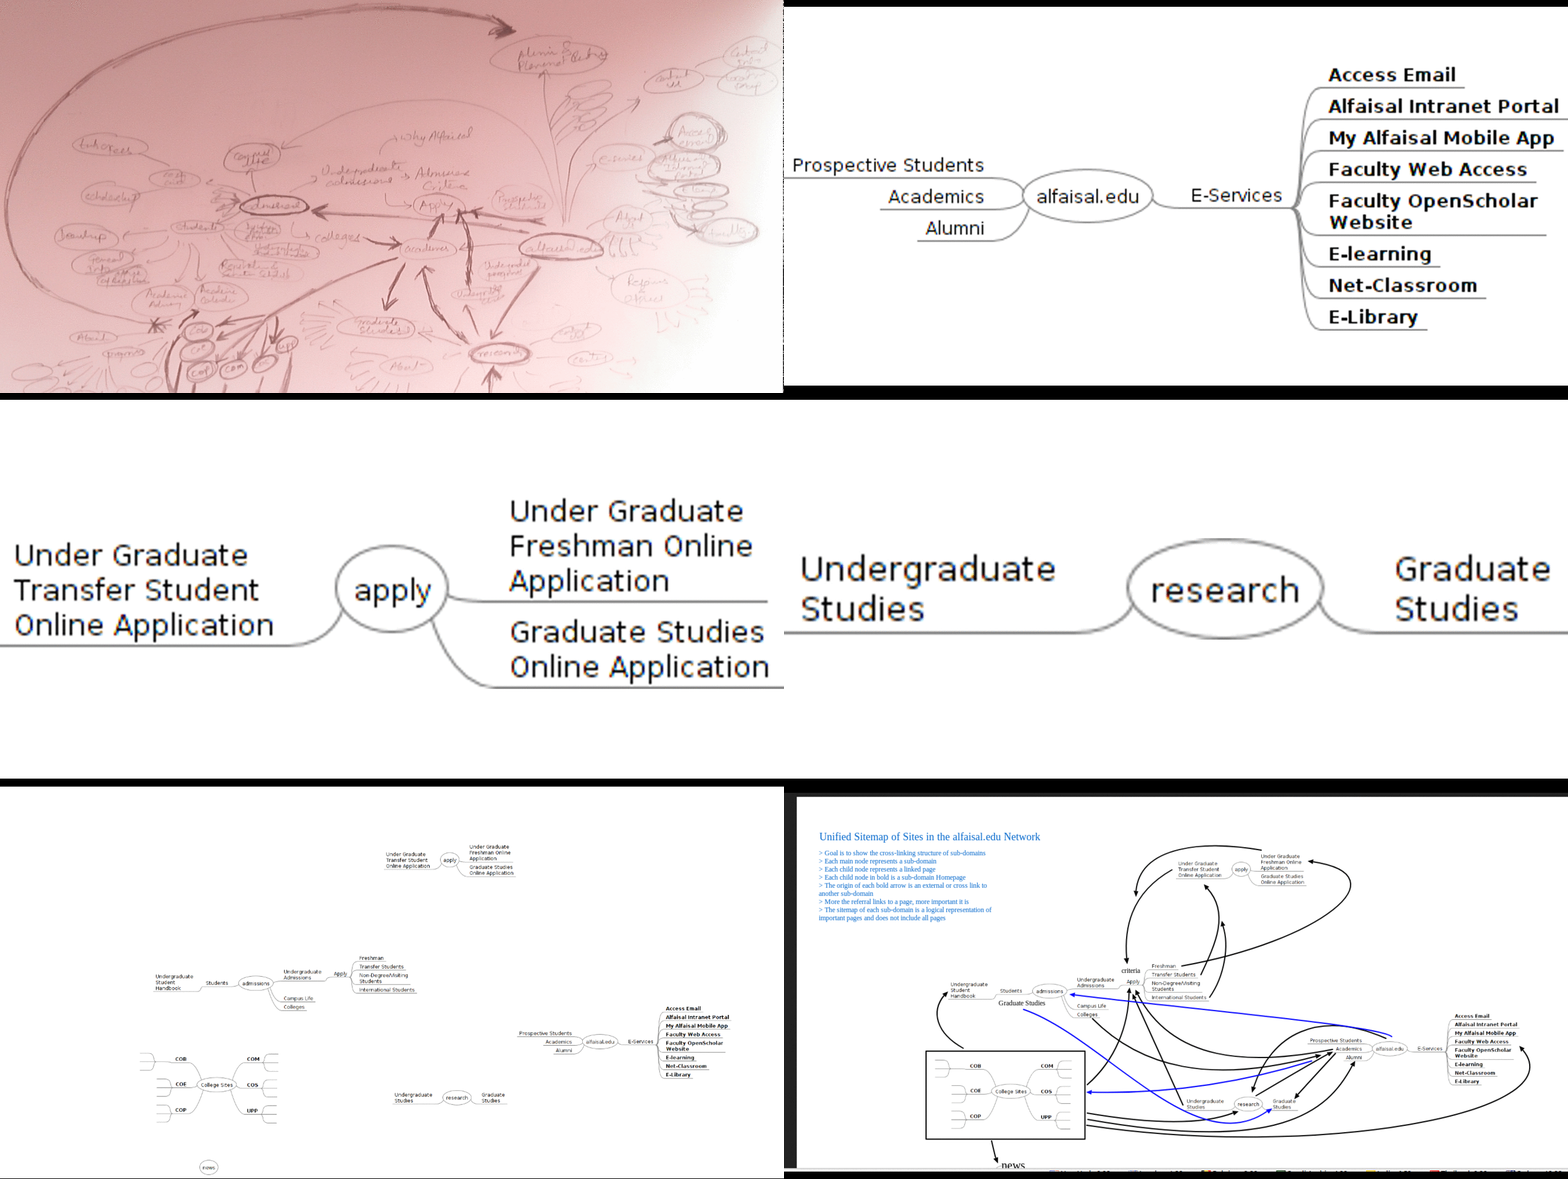
This is a super-sitemap. The process of creation is listed below and also displayed on the GIF media along side:

- Drawing a mind-map on a white-paper:
A mind-map is a visual logical representation of a site with a central node as a Homepage, and child-nodes for each internal navigation level - Connecting the nodes:
After drawing every individual site-map, the cross-linking is studied carefully and lines are drawn connecting the nodes ie particular pages of the sites - Making it digital:
After the complete network is tested thoroughly and put on white paper, It is translated to digital mind-mapping tools (In this case FreeMind). The identical on-paper process should be followed digitally and exported as graphical files (in this case PNGs). - Put it on the canvas:
After all individual mind-maps are created, they should be re-sized and pasted on a single large canvas using a Graphics Editing Tool (in this case GIMP). - Curves to connect:
In the Graphics Editor, Bezzier curves are drawn to show the cross-linking nature of the sites. Curves may be color coded to show importance in the user-journey (in this case the Google Chrome Awesome Screenshot app). - Explain it:
A Legend explaining the key properties of the sitemap should also be written for ready reference of users
And voila! We have a super-sitemap that visually represents the connectedness of all sub-sites in a domain. This becomes a ready reference for linking information, user-journey and induction of new sites. This is a form of data-visualization that can assist any webmaster in optimizing the user-journey of a network of sub-sites in a domain.
